17 July 2015

Raspberry PI Hadoop Cluster

Raspberry PI Hadoop Cluster

hadoop pi boardsIf you like Raspberry Pi's and like to get into Distributed Computing and Big Data processing what could be a better than creating your own Raspberry Pi Hadoop Cluster? 

The tutorial does not assume that you have any previous knowledge of Hadoop. Hadoop is a framework for storage and processing of large amount of data. Or "Big Data" which is a pretty common buzzword those days. The performance of running Hadoop on a Rasperry PI is probably terrible but I hope to be able to make a small and fully functional little cluster to see how it works and perform.

In this tutorial we start with using one Raspberry PI at first and then adding two more after we have a working single node. We will also do some simple performance tests to compare the impact of adding more nodes to the cluster. Last we try to improve and optimize Hadoop for Raspberry Pi cluster.

Fundamentals of Hadoop

What is Hadoop?

"The Apache Hadoop software library is a framework that allows for the distributed processing of large data sets across clusters of computers using simple programming models. It is designed to scale up from single servers to thousands of machines, each offering local computation and storage. Rather than rely on hardware to deliver high-availability, the library itself is designed to detect and handle failures at the application layer, so delivering a highly-available service on top of a cluster of computers, each of which may be prone to failures."

- http://hadoop.apache.org/

Components of Hadoop

Hadoop is built up by a number of components and Open Source frameworks which makes it quite flexible and modular. However before diving deeper into Hadoop it is easier to view it as two main parts – data storage (HDFS) and data processing (MapReduce):

  • HDFS – Hadoop Distributed File System
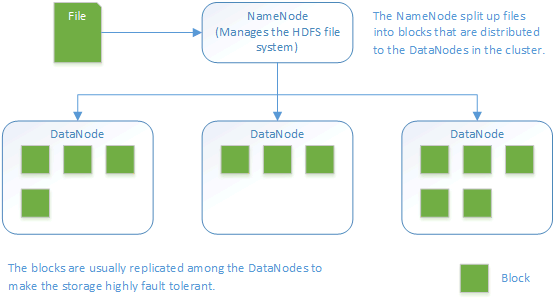
    The Hadoop Distributed File System (HDFS) was designed to run on low cost hardware and is higly fault tolerant. Files are split up into blocks that are replicated to the DataNodes. By default blocks have a size of 64MB and are replicated to 3 nodes in the cluster. However those settings can be adjusted to specific needs. 

    Overview of HDFS File System architecture:
    Hadoop HDFS

  • MapReduce
    MapReduce is a software framework written in Java that is used to create application that can process large amount of data. Although its written in Java there are other languages available to write a MapReduce application. As with HDFS it is built to be fault tolerant and to work in large-scale cluster environments. The framework have the ability to split up input data into smaller tasks (map tasks) that can be executed in parallel processes. The output from the map tasks are then reduced (reduce task) and usually saved to the file system.

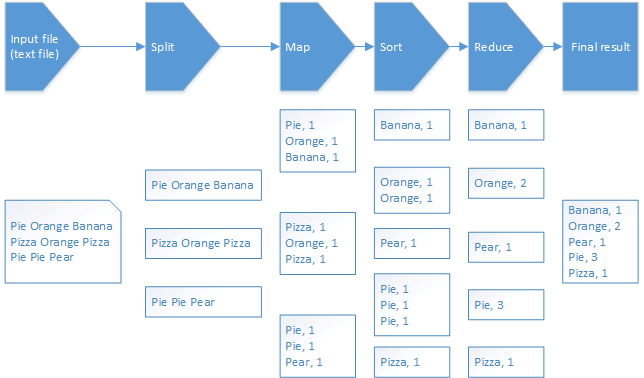
    Below you will see the MapReduce flow of the WordCount sample program that we will use later. WordCount takes a text file as input, divides it into smaller parts and then count each word and outputs a file with a count of all words within the file.

    MapReduce flow overview (WordCount example):
    Hadoop MapReduce WordCount

Daemons/services

Daemon/serviceDescription
NameNodeRuns on a Master node. Manages the HDFS file system on the cluster. 
Secondary NameNodeVery misleading name. It is NOT a backup for the NameNode. It make period checks/updates so in case the NameNode fails it can be restarted without the need to restart the data nodes. – http://wiki.apache.org/hadoop/FAQ#What_is_the_purpose_of_the_secondary_name-node.3F
JobTrackerManages MapReduce jobs and distributes them to the nodes in the cluster.
DataNodeRuns on a slave node. Act as HDFS file storage.
TaskTrackerRuns MapReduce jobs which are received from the JobTracker.

Master and Slaves

  • Master
    Is the node in the cluster that has the namenode and jobtracker. In this tutorial we will also configure our master node to act as both master and slave.
  • Slave
    Node in the cluster that act as a DataNode and TaskTracker.

Note: When a node is running a job the TaskTracker will try to use local data (in its "own" DataNode") if possible. Hence the benefit of having both the DataNode and TaskTracker on the same node since there will be no overhead network traffic. This also implies that it is important to know how data is distributed and stored in HDFS.

Start/stop scripts

ScriptDescription
start-dfs.shStarts NameNode, Secondary NameNode and DataNode(s)
stop-dfs.shStops NameNode, Secondary NameNode and DataNode(s)
start-mapred.shStarts JobTracker and TaskTracker(s)
stop-mapred.shStops JobTracker and TaskTracker(s)

The above scripts should be executed from the NameNode. Through SSH connections daemons will be started on all the nodes in the cluster (all nodes defined in conf/slaves)

Configuration files

Configuration fileDescription
conf/core-site.xmlGeneral site settings such as location of NameNode and JobTracker
conf/hdfs-site.xmlSettings for HDFS file system
conf/mapred-site.xmlSettings for MapReduce daemons and jobs
conf/hadoop-env.shEnvironment configuration settings. Java, SSH and others
conf/masterDefines master node
conf/slavesDefines computing nodes in the cluster (slaves). On a slave this file has the default value of localhost

Web Interface (default ports)

Status and information of Hadoop daemons can be viewed from a web browser through web each dameons web interface:

Daemon/servicePort
NameNode50070
Secondary NameNode50090
JobTracker50030
DataNode(s)50075
TaskTracker(s)50060

hadoop cluster in a shoeboxThe setup

  • Three Raspberry PI's model B
    (Or you could do with one if you only do first part of tutorial)
  • Three 8GB class 10 SD cards
  • An old PC Power Supply
  • An old 10/100 router used as network switch
  • Shoebox from my latest SPD bicycle shoes
  • Raspbian Wheezy 2014-09-09
  • Hadoop 1.2.1
NameIPHadoop Roles
node1192.168.0.110

NameNode
Secondary NameNode
JobTracker
DataNode
TaskTracker

node2192.168.0.111DataNode
TaskTracker
node3192.168.0.112DataNode
TaskTracker

Ensure to adjust names and IP numbers to fit your enivronment.

Single Node Setup

Install Raspbian

Download Raspbian from:
http://downloads.raspberrypi.org/raspbian_latest

For instructions on how to write the image to an SD card and download SD card flashing program please see:
http://www.raspberrypi.org/documentation/installation/installing-images/README.md

For more detailed instructions on how to setup the Pi see:
http://elinux.org/RPi_Hub

Write 2014-09-09-wheezy-raspbian.img to your SD card. Insert the card to your Pi, connect keyboard, screen and network and power it up.

Go through the setup and ensure the following configuration or adjust it to your choice:

  • Expand SD card
  • Set password
  • Choose console login
  • Chose keyboard layout and locales
  • Overclocking, High, 900MHz CPU, 250MHz Core, 450MHz SDRAM (If you do any voltmodding ensure you have a good power supply for the PI)
  • Under advanced options:
    • Hostname: node1
    • Memory split: 16mb
    • Enable SSH Server

Restart the PI.

Configure Network

Install a text editor of your choice and edit as root or with sudo:
/etc/network/interfaces

iface eth0 inet static  address 192.168.0.110  netmask 255.255.255.0  gateway: 192.168.0.1

Edit /etc/resolv.conf and ensure your namesservers (DNS) are configured properly.

Restart the PI.

Configure Java Environment

With the image 2014-09-09-wheezy-raspbian.img Java comes pre-installed. Verify by typing:

java -version    java version "1.8.0"  Java(TM) SE Runtime Environment (build 1.8.0-b132)  Java HotSpot(TM) Client VM (build 25.0-b70, mixed mode)

Prepare Hadoop User Account and Group

sudo addgroup hadoop  sudo adduser --ingroup hadoop hduser  sudo adduser hduser sudo

Configure SSH

Create SSH RSA pair keys with blank password in order for hadoop nodes to be able to talk with each other without prompting for password.

su hduser  mkdir ~/.ssh  ssh-keygen -t rsa -P ""  cat ~/.ssh/id_rsa.pub > ~/.ssh/authorized_keys

Verify that hduser can login to SSH

su hduser  ssh localhost

Go back to previous shell (pi/root).

Install Hadoop

Download and install

cd ~/  wget http://apache.mirrors.spacedump.net/hadoop/core/hadoop-1.2.1/hadoop-1.2.1.tar.gz  sudo mkdir /opt  sudo tar -xvzf hadoop-1.2.1.tar.gz -C /opt/  cd /opt  sudo mv hadoop-1.2.1 hadoop  sudo chown -R hduser:hadoop hadoop

Configure Environment Variables

This configuration assumes that you are using the pre-installed version of Java in 2014-09-09-wheezy-raspbian.img.

Add hadoop to environment variables by adding the following lines to the end of /etc/bash.bashrc:

export JAVA_HOME=$(readlink -f /usr/bin/java | sed "s:bin/java::")  export HADOOP_INSTALL=/opt/hadoop  export PATH=$PATH:$HADOOP_INSTALL/bin

Alternative you can add the configuration above to ~/.bashrc in the home directory of hduser.

Exit and reopen hduser shell to verify hadoop executable is accessible outside /opt/hadoop/bin folder:

exit  su hduser  hadoop version    hduser@node1 /home/hduser $ hadoop version  Hadoop 1.2.1  Subversion https://svn.apache.org/repos/asf/hadoop/common/branches/branch-1.2 -r 1503152  Compiled by mattf on Mon Jul 22 15:23:09 PDT 2013  From source with checksum 6923c86528809c4e7e6f493b6b413a9a  This command was run using /opt/hadoop/hadoop-core-1.2.1.jar

Configure Hadoop environment variables

As root/sudo edit /opt/hadoop/conf/hadoop-env.sh, uncomment and change the following lines:

# The java implementation to use. Required.  export JAVA_HOME=$(readlink -f /usr/bin/java | sed "s:bin/java::")    # The maximum amount of heap to use, in MB. Default is 1000.  export HADOOP_HEAPSIZE=250    # Command specific options appended to HADOOP_OPTS when specified  export HADOOP_DATANODE_OPTS="-Dcom.sun.management.jmxremote $HADOOP_DATANODE_OPTSi -client"

Note 1: If you forget to add the -client option to HADOOP_DATANODE_OPTS you will get the following error messge in hadoop-hduser-datanode-node1.out:

Error occurred during initialization of VM  Server VM is only supported on ARMv7+ VFP

Note 2: If you run SSH on a different port than 22 then you need to change the following parameter:

# Extra ssh options. Empty by default.  # export HADOOP_SSH_OPTS="-o ConnectTimeout=1 -o SendEnv=HADOOP_CONF_DIR"  export HADOOP_SSH_OPTS="-p <YOUR_PORT>"

Or you will get the error:

connect to host localhost port 22: Address family not supported by protocol 

Configure Hadoop

In /opt/hadoop/conf edit the following configuration files:

core-site.xml

<configuration>    <property>      <name>hadoop.tmp.dir</name>      <value>/hdfs/tmp</value>    </property>    <property>      <name>fs.default.name</name>      <value>hdfs://localhost:54310</value>    </property>  </configuration>  

mapred-site.xml

<configuration>    <property>      <name>mapred.job.tracker</name>      <value>localhost:54311</value>    </property>  </configuration>

hdfs-site.xml

<configuration>    <property>      <name>dfs.replication</name>      <value>1</value>    </property>  </configuration> 

Create HDFS file system

sudo mkdir -p /hdfs/tmp  sudo chown hduser:hadoop /hdfs/tmp  sudo chmod 750 /hdfs/tmp  hadoop namenode -format

Start services

Login as hduser. Run:

/opt/hadoop/bin/start-dfs.sh  /opt/hadoop/bin/start-mapred.sh

Run the jps command to checkl that all services started as supposed to:

jps    16640 JobTracker  16832 Jps  16307 NameNode  16550 SecondaryNameNode  16761 TaskTracker  16426 DataNode

If you cannot see all of the processes above review the log files in /opt/hadoop/logs to find the source of the problem.

Run sample test

Upload sample files to HDFS (Feel free to grab any other textfile you like than license.txt):

hadoop dfs -copyFromLocal /opt/hadoop/LICENSE.txt /license.txt

Run wordcount example:

hadoop jar /opt/hadoop/hadoop-examples-1.2.1.jar wordcount /license.txt /license-out.txt

When completed you will see some statistics about the job. If you like to see the outputfile grab the file form HDFS to local file system:

hadoop dfs -copyToLocal /license-out.txt ~/

Open the ~/license-out.txt/part-r-00000 file in any text editor to see the result. (You should have all words in the license.txt file and their number of occurrences)

Single node performance test

For performance test I have put together a few sample files by concatenating textbooks from projectgutenberg and run them in the same manner as the sample test above.

Result:

FileSizeWordcount execution time (mm:ss)
smallfile.txt2MB 2:17
mediumfile.txt35MB 9:19

Download sample text files for performance test.

 I also tried to some larger files but then the PI ran out of memory.

Hadoop Raspberry Pi Cluster Setup

Prepare Node1 for cloning

Since we will make a clone of node1 later the settings made here will be the "base" for all new nodes. 

Edit configuration files

/etc/hosts

192.168.0.110 node1  192.168.0.111 node2  192.168.0.112 node3

In a more serious setup you should use real DNS to setup name lookup, however to make it easy we will just go with the hosts file.

/opt/hadoop/conf/masters

node1  

Note: conf/masters file actually tells which node that is the Secondary NameNode. Node1 will become NameNode when we start the NameNode service on that machine.

In /opt/hadoop/conf edit the following configuration files and change from localhost to node1:

core-site.xml

<configuration>    <property>      <name>hadoop.tmp.dir</name>      <value>/hdfs/tmp</value>    </property>    <property>      <name>fs.default.name</name>      <value>hdfs://node1:54310</value>    </property>  </configuration>  

mapred-site.xml

<configuration>    <property>      <name>mapred.job.tracker</name>      <value>node1:54311</value>    </property>  </configuration>

Wipe HDFS

Note: In the next step we will completely wipte out the current hdfs storage – all files and data that you have used in hdfs will be lost. When you format the namenode there is also an issue causing the error message: Incompatible namespaceIDs in path/to/hdfs. This can happen when starting/doing file operations on the datanode after the namenode has been formatted. This issue is explained more in detail here.

rm -rf /hdfs/tmp/*

Later on we will format the namenode but we do this to ensure the hdfs filesystem is clean on all the nodes.

Clone Node1 and setup slaves

Clone the SD Card of node1 to the other SD cards you plan to use for the other nodes. There are various programs that can do this i used Win32DiskImager.

For each cloned node make sure to:

  • Change hostame in /etc/hostname
  • Change IP Adress in /etc/network/interfaces
  • Restart the Pi.

Configure Node1

/opt/hadoop/conf/slaves

node1  node2  node3

Note: The masters and slaves configuration files are only read by the hadoop start/stop scripts such as: start-all.sh, start-dfs.sh and start-mapred.sh.

On node1, ensure you can reach node2 and node3 from ssh as hduser without need to enter password. If this does not work: copy /home/hduser/.ssh/id_rsa.pub on node1 to /home/hduser/.ssh/authorized_keys on the node that you try to connect to.

su hduser  ssh node1  exit  ssh node2  exit  ssh node3  exit

Enter Yes when you get the "Host key verification failed message".

Format hdfs and start services

On node1:

hadoop namenode -format  /opt/hadoop/bin/start-dfs.sh  /opt/hadoop/bin/start-mapred.sh

Verify that daemons are running correctly

On node1:

jps  3729 SecondaryNameNode  4003 Jps  3607 DataNode  3943 TaskTracker  3819 JobTracker  3487 NameNode

On the other nodes:

jps  2307 TaskTracker  2227 DataNode  2363 Jps

Note: If you have issues you can examine the logfiles /opt/hadoop/logs or you can try to start each service manually on the node that is failing for example:

On node1:
hadoop namenode
hadoop datanode

You may now also try to access hadoop from the web interface to see which nodes that are active and other statistics:

http://node1:50030
http://node1:50070

Hadoop Raspberry Pi performance tests and optimization

For those tests I used the same sample text files as for the single node setup.

Download sample files

Those tests are to highlight some of the issues that can occur when you run hadoop the first time and especially in a Raspberry Pi cluster since it is very limited.  The tests will do some things "very wrong" in order to point out the issues that can occur. If you just want to optimize for the Raspberry Pi you can check out the changes that are made in the last test. Also please notice that those test are done for the mediuim.txt sample file provided above and is no "general-purpose" optimizations. If you have used Hadoop before those test are probably of no use for you since you already have figured out what to do :)

First run

Start two three SSH terminal windows – one for each node. Then start a monitoring program in each of them. I used nmon but you could as well go with top or any other monitor of your choice. Now you will be able to watch the load put on your Pi's by the WordCount MapReduce program.

Go back to your main terminal window (for node1) and upload files to HDFS and run the WordCount program:

hadoop dfs -copyFromLocal mediumfile.txt /mediumfile2.txt  hadoop jar /opt/hadoop/hadoop-examples-1.2.1.jar wordcount /mediumfile2.txt /mediumfile2-out.txt

Then watch the monitors of your nodes. Not much going on on node2 and node3? But node1 is running all of the job? The JobTracker is not distributing the jobs out to our other nodes. This is because as default HDFS is configured for use of really large files and the block-size is set to 64mb. Our file is only 35MB (medium.txt) hence it will only be split into one block and hence only one node can work on it.  

Second run

Optimize block size

In order to tackle the block-size problem above edit the conf/hdfs-site.xml on all your nodes and to the following:

hdfs-site.xml

<configuration>   <property>   <name>dfs.replication</name>   <value>1</value>   </property>   <property>   <name>dfs.block.size</name>   <value>1048576</value>   </property>  </configuration>

The above configuration will set block size to 1mb. Lets make another run and see what happens:

hadoop jar /opt/hadoop/hadoop-examples-1.2.1.jar wordcount /mediumfile2.txt /mediumfile3-out.txt
FileSizeWordCount execution time (mm:ss)
mediumfile.txt35MB 14:24

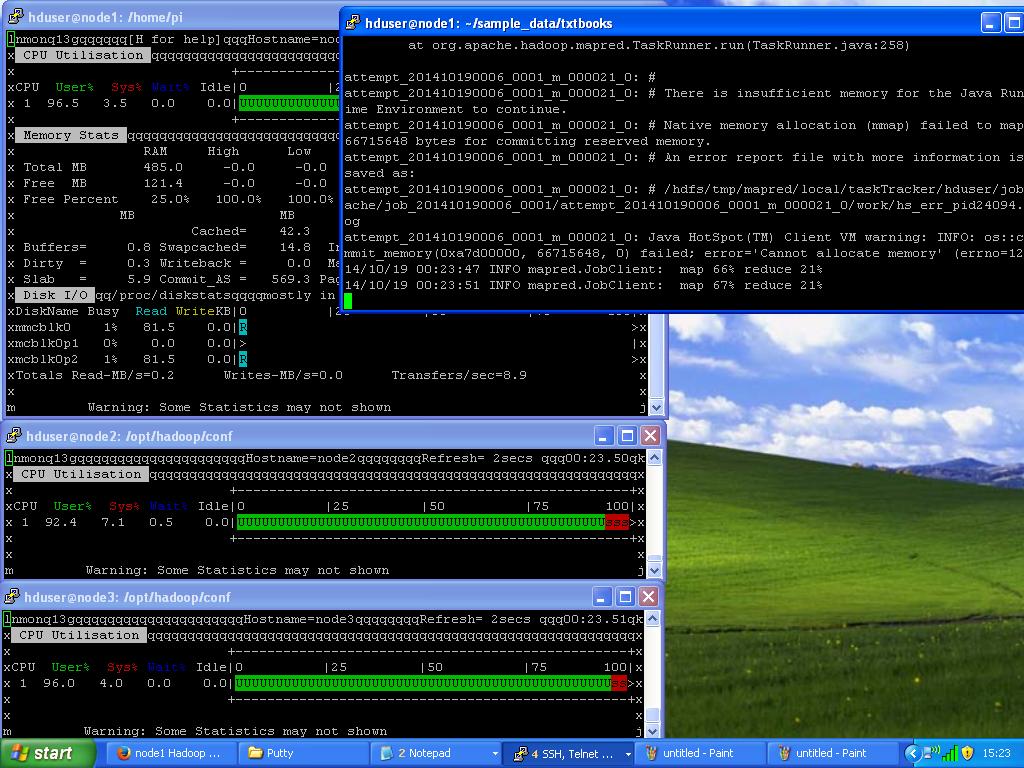
Haddop Terminal MonitoringStill not very impressive, right? It's even worse than the single node setup… This is due to that when you upload a file to HDFS and you do it locally e.g. from a datanode (which we are doing since node1 is a datanode) it will copy the data local. Hence all our blocks are now on node1. Hadoop also tries to run jobs as close as possible to where the data i stored to avoid network overhead. However some of the blocks might get copied over the node2 and node3 for processing but node1 is moste likely to get the most load. Also node1 is running as NameNode and JobTracker and has additional work to do. Also I noticed in several of the jobs the job failed with out of memory exception as seen in picture to the right. Then 1mb of block-size is might be to small even on the Pi's depending on our file size. But now will have our file split into 31 blocks where each block will cause a bit of overhead. (The less blocks we need the better – if we still can evenly spread the blocks across our nodes).

Third run

Optimize block size

Lets make another try. This time we change the block-size to 10mb: (conf/hdfs-site.xml)

hdfs-site.xml

<property>   <name>dfs.block.size</name>   <value>1048576</value>   </property>

Format NameNode

Node1 got a bit overloaded in the previous scenario we will now remove its role as TaskTracker and DataNode. Before we can remove node1 as DataNode format the namenode (as we otherwise would end up with dataloss since we have the dfs.replication set to 1 our data is not redundant)

On all nodes:

rm -rf /hdfs/tmp/*

On node1:

hadoop namenode -format

Configure Node1 to only be master

Edit conf/slaves and remove node1. Then stop and start the cluster again: 

stop-mapred.sh  stop-dfs.sh  start-dfs.sh  start-mapred.sh

Then upload our sample data and start the job again:

hadoop dfs -copyFromLocal mediumfile.txt /mediumfile.txt  hadoop jar /opt/hadoop/hadoop-examples-1.2.1.jar wordcount /mediumfile.txt /mediumfile-out.txt
FileSizeWordCount execution time (mm:ss)
mediumfile.txt35MB 6:26

So now we actually got a bit of improvement compared to a single node setup. This is due to that when you upload a file to HDFS from a client e.g. not locally on the DataNode Hadoop will try to spread the blocks evenly among the nodes and not as in our previous test. However this is still not optimal since now we are not using node1 to its full processing potential. What we would like to do is to have all nodes as DataNodes and TaskTrackers with the file blocks spread nice and evenly on all of them. 

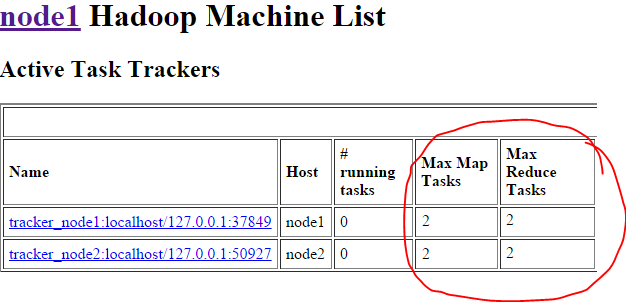
Also if you go to http://node1:50030 and click on number 3 under "nodes" in the table you will see that our nodes are setup to be able to handle 2 map tasks (See picture below). However the Raspberry Pi is a one (and one pretty slow) processor core. It will most likely not perform well of running multiple tasks. So lets set things correct in the last run.
hadoop web task trackers 2

Fourth run

Re-format NameNode (again)

On all nodes:

rm -rf /hdfs/tmp/*

On node1:

hadoop namenode -format

Optimize block size

Lets make the block-size a bit smaller than before. Lower it to 5mb.

<configuration>   <property>   <name>dfs.replication</name>   <value>1</value>   </property>   <property>   <name>dfs.block.size</name>   <value>5242880</value>   </property>  </configuration>

Configure TaskTrackers max tasks

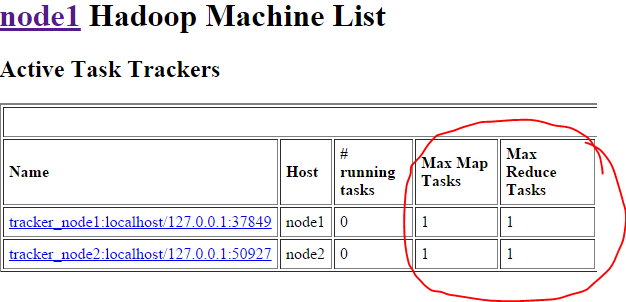
As mentioned in the last text of previous test. If you go to http://node1:50030 and look on your nodes you will se that max map and reducer tasks are set to 2. This is to much for the Raspberry Pi's. We will change max map and reducer tasks to the amount of CPU cores each device has: 1.

On all your nodes:

mapred-site.xml

 <configuration>   <property>   <name>mapred.job.tracker</name>   <value>node1:54311</value>   </property>  <property>  <name>mapred.tasktracker.map.tasks.maximum</name>  <value>1</value>  </property>  <property>  <name>mapred.tasktracker.reduce.tasks.maximum</name>  <value>1</value>  </property>  </configuration>

Configure Node1 back to act as both slave and master

Edit conf/slaves and add node1. Then stop and start the cluster again: 

stop-mapred.sh  stop-dfs.sh  start-dfs.sh  start-mapred.sh

Verify Max Map Tasks and Max Reduce Tasks

Go to http://node1:50030, click your nodes in the cluster summary table and ensure max map and max reduce tasks are set to 1:
hadoop web task trackers

Upload Sample file (again)

hadoop dfs -copyFromLocal mediumfile.txt /mediumfile.txt

Balance HDFS file system

Of course it is possible to upload data on one node and the distribute it evenly across all nodes. Run the following to see how our mediumfile.txt currently is stored:

hadoop fsck /mediumfile.txt -files -blocks -racks

As you most likely will see all the blocks are stored on node1. In order to spread the blocks evenly on all nodes run the following:

hadoop balancer -threshold 0.1

The threshold parameter is a float value from 0 to 100 (percentage). The lower the more balanced your blocks will be. Since we only have one file and that file is a very small percentage of our total storage we need to set it really small to put the balancer into work. After the balancing is complete very the file blocks again by:

hadoop fsck /mediumfile.txt -files -blocks -racks

Last run

hadoop jar /opt/hadoop/hadoop-examples-1.2.1.jar wordcount /mediumfile.txt /mediumfile-out.txt
FileSizeWordCount execution time (mm:ss)
mediumfile.txt35MB 5:26

Finally  we got a bit better performance! There are probably lots of other things we could fine tune more but for this tutorial we are happy with this. If you want to go further there are plenty of stuff to find on google and elsewhere. Hope you enjoyed! Now go code some cool MapReduce jobs and put your cluster to work! :)

Besmir ZANAJ

18 May 2015

LXD crushes KVM in density and speed

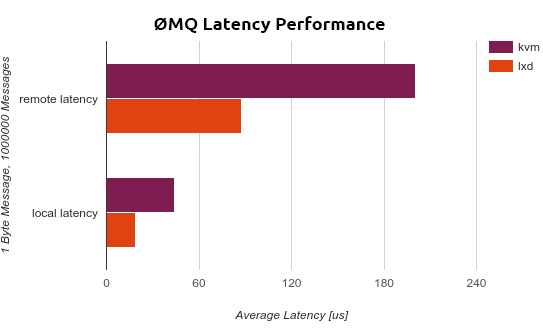
  • LXD achieves 14.5 times greater density than KVM
  • LXD launches instances 94% faster than KVM
  • LXD provides 57% less latency than KVM
LXD is the container-based hypervisor lead by Canonical. Today, Canonical published benchmarks showing that LXD runs guest machines 14.5 times more densely and with 57% less latency than KVM.
The container-based LXD is a dramatic improvement on traditional virtualisation and particularly valuable for large hosting environments. Web applications, for example, can be hosted on a fraction of the hardware using LXD than KVM resulting in substantial long term savings for large organisations.
Latency-sensitive workloads like voice or video transcode showed 57% less latency under LXD than KVM, making LXD an important new tool in the move to network function virtualisation in telecommunications and media, and the convergence of cloud and high performance computing.
Mark Shuttleworth announced the results at the OpenStack Developer Summit in Vancouver, Canada, saying “LXD crushes traditional virtualisation for common enterprise environments, where density and raw performance are the primary concerns. Canonical is taking containers to the level of a full hypervisor, with guarantees of CPU, RAM, I/O and latency backed by silicon and the latest Ubuntu kernels.”
The introduction of containers in Linux by the LinuxContainers.org project, lead by Canonical, has sparked a series of disruptions such as Docker for application distribution, culminating in the recent introduction by Canonical of LXD, which behaves exactly like a full hypervisor but eliminates the overhead of virtualization or machine emulation. While LXD is only suitable for Linux workloads, the majority of guests in OpenStack environments are Linux, making LXD a compelling choice for private clouds where efficiency is highly valued.
Early adopters include institutions with many Linux virtual machines running common code such as Tomcat applications under low load. LXD offers much higher density than KVM as the underlying hypervisor can consolidate common processes more efficiently. LXD’s density comes from the fact that the same kernel is managing all the workload processes, as does its improved latency and quality of service.
Ubuntu is the most popular platform for large-scale KVM virtualisation and the most widely used platform for production OpenStack deployments. “We will of course continue to improve KVM in Ubuntu, but we are extremely excited to enable LXD alongside it for guests where raw performance, density or latency are of particular importance,” said Mark Baker, product manager for OpenStack at Canonical.

The testing

The target platform for this analysis was an Intel server running Ubuntu 14.04 LTS. The testing involved launching as many guest instances as possible with competing hypervisor technologies, LXD and KVM.

Density

In the density test, an automated framework continually launched instances while checking hypervisor resources and stopped when resources were depleted. The same test was used for LXD and KVM; only the command line tool used to launch the images was different.
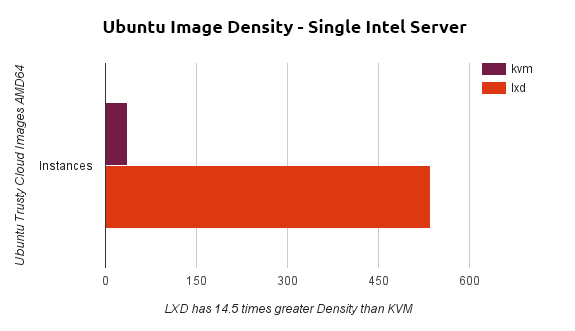
The server with 16GB of RAM was able to launch 37 KVM guests, and 536 identical LXD guests. Each guest was a full Ubuntu system that was able to respond on the network. While LXD cannot magically create additional CPU resources, it can use memory much more efficiently than KVM. For idle or low load workloads, this gives a density improvement of 1450%, or nearly 15 times more density than KVM.
ubuntu_image_density
Containers utilize resources more efficiently at steady-state after booting. As a result, there is a dramatic improvement in the number of instances that can be packed onto a single server providing significant cost benefits due to more efficient utilization of resources.

Speed

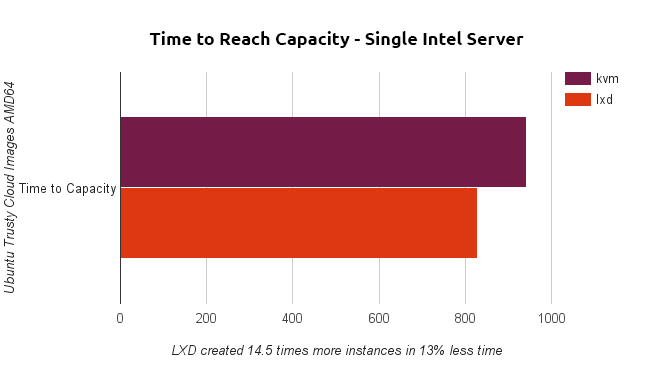
Not only did the test show that LXD could launch and sustain 14.5x the guests than KVM, it also starkly highlighted the difference in startup performance between the two technologies. The full 536 guests started with LXD in substantially less time than it took KVM to launch its 37 guests. On average, LXD guests started in 1.5 seconds, while KVM guests took 25 seconds to start.
time_capacity

Latency

LXD’s container approach lets performance critical applications run at bare metal performance while retaining the isolation of workloads and the ability to support a wide range of Linux operating systems as guests. Without the emulation of a virtual machine, LXD avoids the scheduling latencies and other performance hazards often found in virtualization. Using a sample 0MQ workload, testing resulted in 57% less latency for guests under LXD in comparison to KVM.
latency_performance
More information about LXD can be found at www.ubuntu.com/cloud/tools/lxd.
Canonical is exhibiting at OpenStack Summit, Vancouver. Visit booth P3 for further details and to meet the team.

11 May 2015

Cloud Security Guide for SMEs

From: ENISA.

This guide wants to assist SMEs understand the security risks and opportunities they should take into account when procuring cloud services. 
This document includes a set of security risk, a set of security opportunities and a list of security questions the SME could pose to the provider to understand the level of security. 
The risks and opportunities are linked to the security questions so the end result is customized according to the user's needs and requirements. 
This information is supported by two example use cases and an annex that gives an overview of the data protection legislation applicable and the authorities involved in each country.

 PDF document icon Cloud Security Guide for SMEs.pdf — PDF document, 1,320 kB (1,352,257 bytes)
  English

Infrastructure as a Service (IaaS) - Cloud infrastructure

In the most basic cloud-service model & according to the IETF (Internet Engineering Task Force), providers of IaaS offer computers – physical or (more often) virtual machines – and other resources. 
A hypervisor, such as Xen, Oracle VirtualBox, KVM, VMware ESX/ESXi, or Hyper-V runs the virtual machines as guests. Pools of hypervisors within the cloud operational support-system can support large numbers of virtual machines and the ability to scale services up and down according to customers' varying requirements.
IaaS clouds often offer additional resources such as a virtual-machine disk image library, raw block storage, and file or object storage, firewalls, load balancers, IP addresses, virtual local area networks (VLANs), and software bundles.[52] IaaS-cloud providers supply these resources on-demand from their large pools installed in data centers. For wide-area connectivity, customers can use either the Internet or carrier clouds (dedicated virtual private networks).
To deploy their applications, cloud users install operating-system images and their application software on the cloud infrastructure. In this model, the cloud user patches and maintains the operating systems and the application software. 
Cloud providers typically bill IaaS services on a utility computing basis: cost reflects the amount of resources allocated and consumed

27 February 2015

The steps for ‘Going Cloud’ for Governments and Public Administration

This article is reproduced from the European Network for Information Security Agency.

ENISA’s Security Framework for Governmental Clouds details a step-by-step guide for the Member States (MS) for the procurement and secure use of Cloud services.

This framework addresses the need for a common security framework when deploying Gov Clouds and builds on the conclusions of two previous ENISA studies. It is recommended to be part of the public administrations’ toolbox when planning migration to the Cloud, and when assessing the deployed security controls and procedures.
The suggested framework is structured into four (4) phases, nine (9) security activities and fourteen (14) steps that details the set of actions Member States should follow to define and implement a secure Gov Cloud. In addition the model is empirically validated, through the analysis of four (4) Gov Cloud case studies - Estonia, Greece, Spain and UK – serving also as examples to Gov Cloud implementation.
The framework focuses on the following activities: risk profiling, architectural model, security and privacy requirements, security controls, implementation, deployment, accreditation, log/ monitoring, audit, change management and exit management.
The study shows that the level of adoption of Gov Cloud is still low or in a very early stage. Security and privacy issues are the main barriers and at the same time they become key factors to take into account when migrating to cloud services. Additionally, there is a clear need for Cloud pilots and prototypes to test the utility and effectiveness of the cloud business model for public administration.
 Organisations are switching to Cloud computing, enhancing the effectiveness and efficiencies of ICT. For governments it is cost-efficient and offers important opportunities in terms of scalability, elasticity, performance, resilience and security.
ENISA’s Executive Director commented: “The report provides governments with the necessary tools to successfully deploy Cloud services. Both citizens and businesses benefit from the EU digital single market accessing services across the EU. Cloud computing is a fundamental pillar and enabler for growth and development across the EU”.
The report, is part of the agency’s contribution to the EU Cloud strategy, aimed at national experts, governmental bodies and public administration in the EU, for defining national Cloud security strategy, obtaining a baseline for analysing existing Gov Cloud deployment from the security perspectives, or to support them in filling in their procurement requirements in security. EU policymakers, EU private sector Cloud Service Providers (CSP), and Cloud brokers, can also benefit from the content.
In essence the framework serves as a pre-procurement guide and can be used throughout the entire lifecycle of cloud adoption. The next step by ENISA is to offer this framework as a tool.
For full report: Security Framework for Governmental Clouds
For interviews: Dimitra Liveri, Security & Resilience of Communication Networks, cloud.security@enisa.europa.eu
Background Information:
Previous reports on the subject:
Security and Resilience in Governmental Clouds
Good practice Guide for securely deploying Governmental Clouds

30 November 2014

Moving away from Puppet: SaltStack or Ansible?

Really well detailed article from: http://ryandlane.com/blog/2014/08/04/moving-away-from-puppet-saltstack-or-ansible/


Over the past month at Lyft we’ve been working on porting our infrastructure code away from Puppet. We had some difficulty coming to agreement on whether we wanted to use SaltStack (Salt) or Ansible. We were already using Salt for AWS orchestration, but we were divided on whether Salt or Ansible would be better for configuration management. We decided to settle it the thorough way by implementing the port in both Salt and Ansible, comparing them over multiple criteria.
First, let me start by explaining why we decided to port away from Puppet: We had a complex puppet code base that has around 10,000 lines of actual Puppet code. This code was originally spaghetti-code oriented and in the past year or so was being converted to a new pattern that used Hiera and Puppet modules split up into services and components. It’s roughly the role pattern, for those familiar with Puppet. The code base was a mixture of these two patterns and our DevOps team was comprised of almost all recently hired members who were not very familiar with Puppet and were unfamiliar with the code base. It was large, unwieldy and complex, especially for our core application. Our DevOps team was getting accustom to the Puppet infrastructure; however, Lyft is strongly rooted in the concept of ‘If you build it you run it’. The DevOps team felt that the Puppet infrastructure was too difficult to pick up quickly and would be impossible to introduce to our developers as the tool they’d use to manage their own services.
Before I delve into the comparison, we had some requirements of the new infrastructure:
  1. No masters. For Ansible this meant using ansible-playbook locally, and for Salt this meant using salt-call locally. Using a master for configuration management adds an unnecessary point of failure and sacrifices performance.
  2. Code should be as simple as possible. Configuration management abstractions generally lead to complicated, convoluted and difficult to understand code.
  3. No optimizations that would make the code read in an illogical order.
  4. Code must be split into two parts: base and service-specific, where each would reside in separate repositories. We want the base section of the code to cover configuration and services that would be deployed for every service (monitoring, alerting, logging, users, etc.) and we want the service-specific code to reside in the application repositories.
  5. The code must work for multiple environments (development, staging, production).
  6. The code should read and run in sequential order.
Here’s how we compared:
  1. Simplicity/Ease of Use
  2. Maturity
  3. Performance
  4. Community

Simplicity/Ease of Use

Ansible:
A couple team members had a strong preference to using Ansible as they felt it was easier to use than Salt, so I started by implementing the port in Ansible, then implementing it again in Salt.
As I started Ansible was indeed simple. The documentation was clearly structured which made learning the syntax and general workflow relatively simple. The documentation is oriented to running Ansible from a controller and not locally, which made the initial work slightly more difficult to pick up, but it wasn’t a major stumbling block. The biggest issue was needing to have an inventory file with ‘localhost’ defined and needing to use -c local on the command line. Additionally, Ansible’s playbook’s structure is very simple. There’s tasks, handlers, variables and facts. Tasks do the work in order and can notify handlers to do actions at the end of the run. The variables can be used via Jinja in the playbooks or in templates. Facts are gathered from the system and can be used like variables.
Developing the playbook was straightforward. Ansible always runs in order and exits immediately when an error occurs. This made development relatively easy and consistent. For the most part this also meant that when I destroyed my vagrant instance and recreated it that my playbook was consistently run.
That said, as I was developing I noticed that my ordering was occasionally problematic and needed to move things around. As I finished porting sections of the code I’d occasionally destroy and up my vagrant instance and re-run the playbook, then noticed errors in my execution. Overall using ordered execution was far more reliable than Puppet’s unordered execution, though.
My initial playbook was a single file. As I went to split base and service apart I noticed some complexity creeping in. Ansible includes tasks and handlers separately and when included the format changes, which was confusing at first. My playbook was now: playbook.yml, base.yml, base-handlers.yml, service.yml, and service-handlers.yml. For variables I had: user.yml and common.yml. As I was developing I generally needed to keep the handlers open so that I could easily reference them for the tasks.
The use of Jinja in Ansible is well executed. Here’s an example of adding users from a dictionary of users:
- name: Ensure groups exist
  group: name={{ item.key }} gid={{ item.value.id }}
  with_dict: users

- name: Ensure users exist
  user: name={{ item.key }} uid={{ item.value.id }} group={{ item.key }} groups=vboxsf,syslog comment="{{ item.value.full_name }}" shell=/bin/bash
  with_dict: users
For playbooks Ansible uses Jinja for variables, but not for logic. Looping and conditionals are built into the DSL. with/when/etc. control how individual tasks are handled. This is important to note because that means you can only loop over individual tasks. A downside of Ansible doing logic via the DSL is that I found myself constantly needing to look at the documentation for looping and conditionals. Ansible has a pretty powerful feature since it controls its logic itself, though: variable registration. Tasks can register data into variables for use in later tasks. Here’s an example:
- name: Check test pecl module
  shell: "pecl list | grep test | awk '{ print $2 }'"
  register: pecl_test_result
  ignore_errors: True
  changed_when: False

- name: Ensure test pecl module is installed
  command: pecl install -f test-1.1.1
  when: pecl_test_result.stdout != ‘1.1.1’
This is one of Ansible’s most powerful tools, but unfortunately Ansible also relies on this for pretty basic functionality. Notice in the above what’s happening. The first task checks the status of a shell command then registers it to a variable so that it can be used in the next task. I was displeased to see it took this much effort to do very basic functionality. This should be a feature of the DSL. Puppet, for instance, has a much more elegant syntax for this:
exec { ‘Ensure redis pecl module is installed’:
  command => ‘pecl install -f redis-2.2.4’,
  unless  => ‘pecl list | grep redis | awk \’{ print $2 }\’’;
}
I was initially very excited about this feature, thinking I’d use it often in interesting ways, but as it turned out I only used the feature for cases where I needed to shell out in the above pattern because a module didn’t exist for what I needed to do.
Some of the module functionality was broken up into a number of different modules, which made it difficult to figure out how to do some basic tasks. For instance, basic file operations are split between the file, copy, fetch, get_url, lineinfile, replace, stat and template modules. This was annoying when referencing documentation, where I needed to jump between modules until I found the right one. The shell/command module split is much more annoying, as command will only run basic commands and won’t warn you when it’s stripping code. A few times I wrote a task using the command module, then later changed the command being run. The new command actually required the use of the shell module, but I didn’t realize it and spent quite a while trying to figure out what was wrong with the execution.
I found the input, output, DSL and configuration formats of Ansible perplexing. Here’s some examples:
  • Ansible and inventory configuration: INI format
  • Custom facts in facts.d: INI format
  • Variables: YAML format
  • Playbooks: YAML format, with key=value format inline
  • Booleans: yes/no format in some places and True/False format in other places
  • Output for introspection of facts: JSON format
  • Output for playbook runs: no idea what format
Output for playbook runs was terse, which was generally nice. Each playbook task output a single line, except for looping, which printed the task line, then each sub-action. Loop actions over dictionaries printed the dict item with the task, which was a little unexpected and cluttered the output. There is little to no control over the output.
Introspection for Ansible was lacking. To see the value of variables in the format actually presented inside of the language it’s necessary to use the debug task inside of a playbook, which means you need to edit a file and do a playbook run to see the values. Getting the facts available was more straightforward: ‘ansible -m setup hostname’. Note that hostname must be provided here, which is a little awkward when you’re only ever going to run locally. Debug mode was helpful, but getting in-depth information about what Ansible was actually doing inside of tasks was impossible without diving into the code, since every task copies a python script to /tmp and executes it, hiding any real information.
When I finished writing the playbooks, I had the following line length/character count:
 15     48     472   service-handlers.yml
 463    1635   17185 service.yml
 27     70     555   base-handlers.yml
 353    1161   11986 base.yml
 15     55     432   playbook.yml
 873    2969   30630 total
There were 194 tasks in total.
Salt:
Salt is initially difficult. The organization of the documentation is poor and the text of the documentation is dense, making it difficult for newbies. Salt assumes you’re running in master/minion mode and uses absolute paths for its states, modules, etc.. Unless you’re using the default locations, which are poorly documented for masterless mode, it’s necessary to create a configuration file. The documentation for configuring the minion is dense and there’s no guides for normal configuration modes. States and pillars both require a ‘top.sls’ file which define what will be included per-host (or whatever host matching scheme you’re using); this is somewhat confusing at first.
Past the initial setup, Salt was straightforward. Salt’s state system has states, pillars and grains. States are the YAML DSL used for configuration management, pillars are user defined variables and grains are variables gathered from the system. All parts of the system except for the configuration file are templated through Jinja.
Developing Salt’s states was straightforward. Salt’s default mode of operation is to execute states in order, but it also has a requisite system, like Puppet’s, which can change the order of the execution. Triggering events (like restarting a service) is documented using the watch or watch_in requisite, which means that following the default documentation will generally result in out-of-order execution. Salt also provides the listen/listen_in global state arguments which execute at the end of a state run and do not modify ordering. By default Salt does not immediately halt execution when a state fails, but runs all states and returns the results with a list of failures and successes. It’s possible to modify this behavior via the configuration. Though Salt didn’t exit on errors, I found that I had errors after destroying my vagrant instance then rebuilding it at a similar rate to Ansible. That said, I did eventually set the configuration to hard fail since our team felt it would lead to more consistent runs.
My initial state definition was in a single file. Splitting this apart into base and service states was very straightforward. I split the files apart and included base from service. Salt makes no distinction between states and commands being notified (handlers in Ansible); there’s just states, so base and service each had their associated notification states in their respective files. At this point I had: top.sls, base.sls and service.sls for states. For pillars I had top.sls, users.sls and common.sls.
The use of Jinja in Salt is well executed. Here’s an example of adding users from a dictionary of users:
{% for name, user in pillar['users'].items() %}
  Ensure user {{ name }} exist:
    user.present:
      - name: {{ name }}
      - uid: {{ user.id }}
      - gid_from_name: True
      - shell: /bin/bash
      - groups:
        - vboxsf
        - syslog
        - fullname: {{ user.full_name }}
{% endfor %}
Salt uses Jinja for both state logic and templates. It’s important to note that Salt uses Jinja for state logic because it means that the Jinja is executed before the state. A negative of this is that you can’t do something like this:
Ensure myelb exists:
  boto_elb.present:
    - name: myelb
    - availability_zones:
      - us-east-1a
    - listeners:
      - elb_port: 80
        instance_port: 80
        elb_protocol: HTTP
      - elb_port: 443
        instance_port: 80
        elb_protocol: HTTPS
        instance_protocol: HTTP
        certificate: 'arn:aws:iam::879879:server-certificate/mycert'
      - health_check:
          target: 'TCP:8210'
    - profile: myprofile

{% set elb = salt['boto_elb.get_elb_config']('myelb', profile='myprofile') %}

{% if elb %}
Ensure myrecord.example.com cname points at ELB:
  boto_route53.present:
    - name: myrecord.example.com.
    - zone: example.com.
    - type: CNAME
    - value: {{ elb.dns_name }}
{% endif %}
That’s not possible because the Jinja running ’set elb’ is going to run before ‘Ensure myelb exists’, since the Jinja is always rendered before the states are executed.
On the other hand, since Jinja is executed first, it means you can wrap multiple states in a single loop:
{% for module, version in {
       ‘test’: (‘1.1.1’, 'stable'),
       ‘hello’: (‘1.2.1’, 'stable'),
       ‘world’: (‘2.2.2’, 'beta')
   }.items() %}
Ensure {{ module }} pecl module is installed:
  pecl.installed:
    - name: {{ module }}
    - version: {{ version[0] }}
    - preferred_state: {{ version[1] }}

Ensure {{ module }} pecl module is configured:
  file.managed:
    - name: /etc/php5/mods-available/{{ module }}.ini
    - contents: "extension={{ module }}.so"
    - listen_in:
      - cmd: Restart apache

Ensure {{ module }} pecl module is enabled for cli:
  file.symlink:
    - name: /etc/php5/cli/conf.d/{{ module }}.ini
    - target: /etc/php5/mods-available/{{ module }}.ini

Ensure {{ module }} pecl module is enabled for apache:
  file.symlink:
    - name: /etc/php5/apache2/conf.d/{{ module }}.ini
    - target: /etc/php5/mods-available/{{ module }}.ini
    - listen_in:
      - cmd: Restart apache
{% endfor %}
Of course something similar to Ansible’s register functionality isn’t available either. This turned out to be fine, though, since Salt has a very feature rich DSL. Here’s an example of a case where it was necessary to shell out:
# We need to ensure the current link points to src.git initially
# but we only want to do so if there’s not a link there already,
# since it will point to the current deployed version later.
Ensure link from current to src.git exists if needed:
  file.symlink:
    - name: /srv/service/current
    - target: /srv/service/src.git
    - unless: test -L /srv/service/current
Additionally, as a developer who wanted to switch to either Salt or Ansible because it was Python, it was very refreshing to use Jinja for logic in the states rather than something built into the DSL, since I didn’t need to look at the DSL specific documentation for looping or conditionals.
Salt is very consistent when it comes to input, output and configuration. Everything is YAML by default. Salt will happily give you output in a number of different formats, including ones you create yourself via outputter modules. The default output of state runs shows the status of all states, but can be configured in multiple ways. I ended up using the following configuration:
# Show terse output for successful states and full output for failures.
state_output: mixed
# Only show changes
state_verbose: False
State runs that don’t change anything show nothing. State runs that change things will show the changes as single lines, but failures show full output so that it’s possible to see stacktraces.
Introspection for Salt was excellent. Both grains and pillars were accessible from the CLI in a consistent manner (salt-call grains.items; salt-call pillar.items). Salt’s info log level shows in-depth information of what is occurring per module. Using the debug log level even shows how the code is being loaded, the order it’s being loaded in, the OrderedDict that’s generated for the state run, the OrderedDict that’s used for the pillars, the OrderedDict that’s used for the grains, etc.. I found it was very easy to trace down bugs in Salt to report issues and even quickly fix some of the bugs myself.
When I finished writing the states, I had the following word/character count:
527    1629   14553 api.sls
6      18     109   top.sls
576    1604   13986 base/init.sls
1109   3251   28648 total
There were 151 salt states in total.
Notice that though there’s 236 more lines of Salt, there’s in total fewer characters. This is because Ansible has a short format which makes its lines longer, but uses less lines overall. This makes it difficult to directly compare by lines of code. Number of states/tasks is a better metric to go by anyway, though.

Maturity

Both Salt and Ansible are currently more than mature enough to replace Puppet. At no point was I unable to continue because a necessary feature was missing from either.
That said, Salt’s execution and state module support is more mature than Ansible’s, overall. An example is how to add users. It’s common to add a user with a group of the same name. Doing this in Ansible requires two tasks:
- name: Ensure groups exist
  group: name={{ item.key }} gid={{ item.value.id }}
  with_dict: users

- name: Ensure users exist
  user: name={{ item.key }} uid={{ item.value.id }} group={{ item.key }} groups=vboxsf,syslog comment="{{ item.value.full_name }}" shell=/bin/bash
  with_dict: users
Doing the same in Salt requires one:
{% for name, user in pillar['users'].items() %}
Ensure user {{ name }} exist:
  user.present:
    - name: {{ name }}
    - uid: {{ user.id }}
    - gid_from_name: True
    - shell: /bin/bash
    - groups:
      - vboxsf
      - syslog
    - fullname: {{ user.full_name }}
{% endfor %}
Additionally, Salt’s user module supports shadow attributes, where Ansible’s does not.
Another example is installing a debian package from a url. Doing this in Ansible is two tasks:
- name: Download mypackage debian package
  get_url: url=https://s3.amazonaws.com/mybucket/mypackage/mypackage_0.1.0-1_amd64.deb dest=/tmp/mypackage_0.1.0-1_amd64.deb

- name: Ensure mypackage is installed
  apt: deb=/tmp/mypackage_0.1.0-1_amd64.deb
Doing the same in Salt requires one:
Ensure mypackage is installed:
  pkg.installed:
    - sources:
    - mypackage: https://s3.amazonaws.com/mybucket/mypackage/mypackage_0.1.0-1_amd64.deb
Another example is fetching files from S3. Salt has native support for this where files are referenced in many modules, while in Ansible you must use the s3 module to download a file to a temporary location on the filesystem, then use one of the file modules to manage it.
Salt has state modules for the following things that Ansible did not have:
  • pecl
  • mail aliases
  • ssh known hosts
Ansible had a few broken modules:
  • copy: when content is used, it writes POSIX non-compliant files by default. I opened an issue for this and was marked as won’t fix. More on this in the Community section.
  • apache2_module: always reports changes for some modules. I opened an issue it was marked as a duplicate. Fix in a pull request, open as of this writing with no response since June 24, 2014.
  • supervisorctl: doesn’t handle a race condition properly where a service starts after it checks its status. Fix in a pull request, open as of this writing with no response since June 29, 2014. Unsuccessfully fixed in a pull request on Aug 30, 2013, issue still marked as closed, though there are reports of it still being broken.
Salt had broken modules as well, both of which were broken in the same way as the Ansible equivalents, which was amusing:
  • apache_module: always reports changes for some modules. Fixed in upcoming release.
  • supervisorctl: doesn’t handle a race condition properly where a service starts after it checks its status. Fixed in upcoming release.
Past basic module support, Salt is more far more feature rich:
  • Salt can output in a number of different formats, including custom ones (via outputters)
  • Salt can output to other locations like mysql, redis, mongo, or custom locations (via returners)
  • Salt can load its pillars from a number of locations, including custom ones (via external pillars)
  • If running an agent, Salt can fire local events that can be reacted upon (via reactors); if using a master it’s also possible to react to events from minions.

Performance

Salt was faster than Ansible for state/playbook runs. For no-change runs Salt was considerably faster. Here’s some performance data for each, for full runs and no-change runs. Note that these runs were relatively consistent across large numbers of system builds in both vagrant and AWS and the full run times were mostly related to package/pip/npm/etc installations:
Salt:
  • Full run: 12m 30s
  • No change run: 15s
Ansible:
  • Full run: 16m
  • No change run: 2m
I was very surprised at how slow Ansible was when making no changes. Nearly all of this time was related to user accounts, groups, and ssh key management. In fact, I opened an issue for it. Ansible takes on average .5 seconds per user, but this extends to other modules that use loops over large dictionaries. As the number of users managed grows our no-change (and full-change) runs will grow with it. If we double our managed users we’ll be looking at 3-4 minute no-change runs.
I mentioned in the Simplicity/Ease of Use section that I had started this project by developing with Ansible and then re-implementing in Salt, but as time progressed I started implementing in Salt while Ansible was running. By the time I got half-way through implementing in Ansible I had already finished implementing everything in Salt.

Community

There’s a number of ways to rate a community. For Open Source projects I generally consider a few things:
  1. Participation
In terms of development participation Salt has 4 times the number of merged pull requests (471 for Salt and 112 for Ansible) in a one month period at the time of this writing. It also three times the number of total commits. Salt is also much more diverse from a perspective of community contribution. Ansible is almost solely written by mpdehaan. Nearly the top 10 Salt contributors have more commits than the #2 committer for Ansible. That said, Ansible has more stars and forks on GitHub, which may imply a larger user community.
Both Salt and Ansible have a very high level of participation. They are generally always in the running with each other for the most active GitHub project, so in either case you should feel assured the community is strong.
  1. Friendliness
Ansible has a somewhat bad reputation here. I’ve heard anecdotal stories of people being kicked out of the Ansible community. While originally researching Ansible I had found some examples of rude behavior to well meaning contributors. I did get a “pull request welcome” response on a legitimate bug, which is an anti-pattern in the open source world. That said, the IRC channel was incredibly friendly and all of the mailing list posts I read during this project were friendly as well.
Salt has an excellent reputation here. They thank users for bug reports and code. They are very receptive and open to feature requests. They respond quickly on the lists, email, twitter and IRC in a very friendly manner. The only complaint that I have here is that they are sometimes less rigorous than they should be when it comes to accepting code (I’d like to see more code review).
  1. Responsiveness
I opened 4 issues while working on the Ansible port. 3 were closed won’t fix and 1 was marked as a duplicate. Ansible’s issue reporting process is somewhat laborious. All issues must use a template, which requires a few clicks to get to and copy/paste. If you don’t use the template they won’t help you (and will auto-close the issue after a few days).
Of the issues marked won’t fix:
  1. user/group module slow: Not considered a bug that Ansible can do much about. Issue was closed with basically no discussion. I was welcomed to start a discussion on the mailing list about it. (For comparison: Salt checks all users, groups and ssh keys in roughly 1 second)
  2. Global ignore_errors: Feature request. Ansible was disinterested in the feature and the issue was closed without discussion.
  3. Content argument of copy module doesn’t add end of file character: The issue was closed won’t fix without discussion. When I linked to the POSIX spec showing why it was a bug the issue wasn’t reopened and I was told I could submit a patch. At this point I stopped submitting further bug reports.
Salt was incredibly responsive when it comes to issues. I opened 19 issues while working on the port. 3 of these issues weren’t actually bugs and I closed them on my own accord after discussion in the issues. 4 were documentation issues. Let’s take a look at the rest of the issues:
  1. pecl state missing argument: I submitted an issue with a pull request. It was merged and closed the same day.
  2. Stacktrace when fetching directories using the S3 module: I submitted an issue with a pull request. It was merged the same day and the issue was closed the next.
  3. grains_dir is not a valid configuration option: I submitted an issue with no pull request. I was thanked for the report and the issue was marked as Approved the same day. The bug was fixed and merged in 4 days later.
  4. Apache state should have enmod and dismod capability: I submitted an issue with a pull request. It was merged and closed the same day.
  5. The hold argument is broken for pkg.installed: I submitted an issue without a pull request. I got a response the same day. The bug was fixed and merged the next day.
  6. Sequential operation relatively impossible currently: I submitted an issue without a pull request. I then went into IRC and had a long discussion with the developers about how this could be fixed. The issue was with the use of watch/watch_in requisites and how it modifies the order of state runs. I proposed a new set of requisites that would work like Ansible’s handlers. The issue was marked Approved after the IRC conversation. Later that night the founder (Thomas Hatch) wrote and merged the fix and let me know about it via Twitter. The bug was closed the following day.
  7. Stacktrace with listen/listen_in when key is not valid: This bug was a followup to the listen/listen_in feature. It was fixed/merged and closed the same day.
  8. Stacktrace using new listen/listen_in feature: This bug was an additional followup to the listen/listen_in feature and was reported at the same time as the previous one. It was fixed/merged and closed the same day.
  9. pkgrepo should only run refresh_db once: This is a feature request to save me 30 seconds on occasional state runs. It’s still open at the time of this writing, but was marked as Approved and the discussion has a recommended solution.
  10. refresh=True shouldn’t run when package specifies version and it matches. This is a feature request to save me 30 seconds on occasional state runs. It was fixed and merged 24 days later, but the bug still shows open (it’s likely waiting for me to verify).
  11. Add an enforce option to the ssh_auth state: This is a feature request. It’s still open at the time of this writing, but it was approved the same day.
  12. Allow minion config options to be modified from salt-call: This is a feature request. It’s still open at the time of this writing, but it was approved the same day and a possible solution was listed in the discussion.
All of these bugs, except for the listen/listen_in feature could have easily been worked around, but I felt confident that if I submitted an issue the bug would get fixed, or I’d be given a reasonable workaround. When I submitted issues I was usually thanked for the issue submission and I got confirmation on whether or not my issue was approved to be fixed or not. When I submitted code I was always thanked and my code was almost always merged in the same day. Most of the issues I submitted were fixed within 24 hours, even a relatively major change like the listen/listen_in feature.
  1. Documentation
For new users Ansible’s documentation is much better. The organization of the docs and the brevity of the documentation make it very easy to get started. Salt’s documentation is poorly organized and is very dense, making it difficult to get started.
While implementing the port, I found the density of Salt’s docs to be immensely helpful and the brevity of Ansible’s docs to be be infuriating. I spent much longer periods of time trying to figure out the subtleties of Ansible’s modules since they were relatively undocumented. Not a single module has the variable registration dictionary documented in Ansible, which required me to write a debug task and run the playbook every time I needed to register a variable, which was annoyingly often.
Salt’s docs are unnecessarily broken up, though. There’s multiple sections on states. There’s multiple sections on global state arguments. There’s multiple sections on pillars. The list goes on. Many of these docs are overlapping, which makes searching for the right doc difficult. The split of execution modules and state modules (which I rather enjoy when doing salt development) make searching for modules more difficult when writing states.
I’m a harsh critic of documentation though, so for both Salt and Ansible, you should take this with a grain of salt (ha ha) and take a look at the docs yourself.

Conclusion

At this point both Salt and Ansible are viable and excellent options for replacing Puppet. As you may have guessed by now, I’m more in favor of Salt. I feel the language is more mature, it’s much faster and the community is friendlier and more responsive. If I couldn’t use Salt for a project, Ansible would be my second choice. Both Salt and Ansible are easier, faster, and more reliable than Puppet or Chef.
As you may have noticed earlier in this post, we had 10,000 lines of puppet code and reduced that to roughly 1,000 in both Salt and Ansible. That alone should speak highly of both.
After implementing the port in both Salt and Ansible, the Lyft DevOps team all agreed to go with Salt.

04 November 2014

Ubuntu Cloud documentation – 14.04 LTS


Deploying production grade OpenStack with MAAS, Juju and Landscape
This documentation has been created to describe best practice in deploying a production grade installation of OpenStack using current Canonical technologies, including bare metal provisioning using MAAS, service orchestration with Juju and system management with Landscape.
This installation documentation is divided into four main topics:
  1. Installing the MAAS Metal As A Service software
  2. Installing Juju and configuring it to work with MAAS
  3. Using Juju to deploy OpenStack
  4. Deploying Landscape to manage your OpenStack cloud

Creating a new LDAP server with FreeIPA and configure to allow vSphere authentication

Was setting up a new FreeIPA sever for my homelab and found out that the default configuration in FreeIPA does not allow you to use VMware v...